Impact Score & Benchmarking
Know exactly where your product stands. Compare against the market with Monte Carlo simulations and real EPD data.
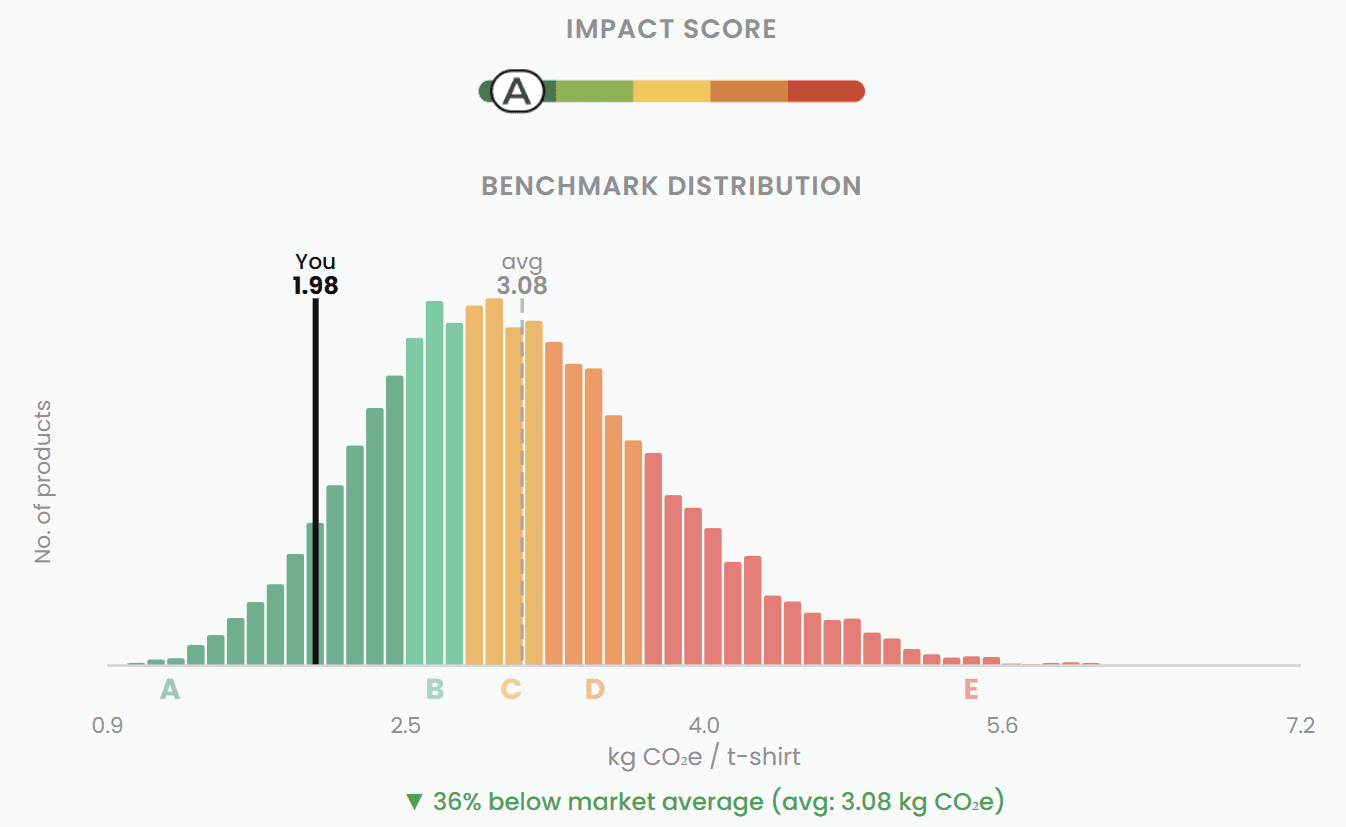
A to E, clear and actionable
Based on your product's percentile within the simulated market distribution.
From your report to score in ~60 seconds
Subcategory Classification
~3sThe system classifies your product into a functional subcategory (e.g., "t-shirt", "shampoo", "smartphone") to compare against equivalent products.
Real EPD Search
~10sSearches for published Environmental Product Declarations (EPDs) on the web to calibrate the market distribution. Real data, not estimates.
Parameter Generation
~20sClaude generates statistical parameters per lifecycle phase, calibrated with the EPDs found. All parameters are auditable.
Monte Carlo Simulation
~2s10,000 iterations generate the complete market distribution. Your product is positioned in this distribution with a precise percentile.
A-E Score + Histogram
~5sFinal score with natural language explanation and distribution chart with your product marked. Exportable as image.
Why it's different
Monte Carlo
Not a static comparison point. It's a full statistical market distribution.
Real Calibration
Parameters are calibrated with published EPDs found via web search. Not made-up numbers.
Per-Phase Breakdown
Not just the total — see how each phase (materials, manufacturing, transport, use, EoL) contributes to the score.
Explore Our Published Benchmarks
Research reports with real data — Monte Carlo histograms, EPD comparisons, and per-phase breakdowns for products across industries.
Browse Industry BenchmarksReady to measure your impact?
Get your Product Carbon Footprint in minutes, not months.