
Grid Emission Factors Explained: A Practical LCA Guide
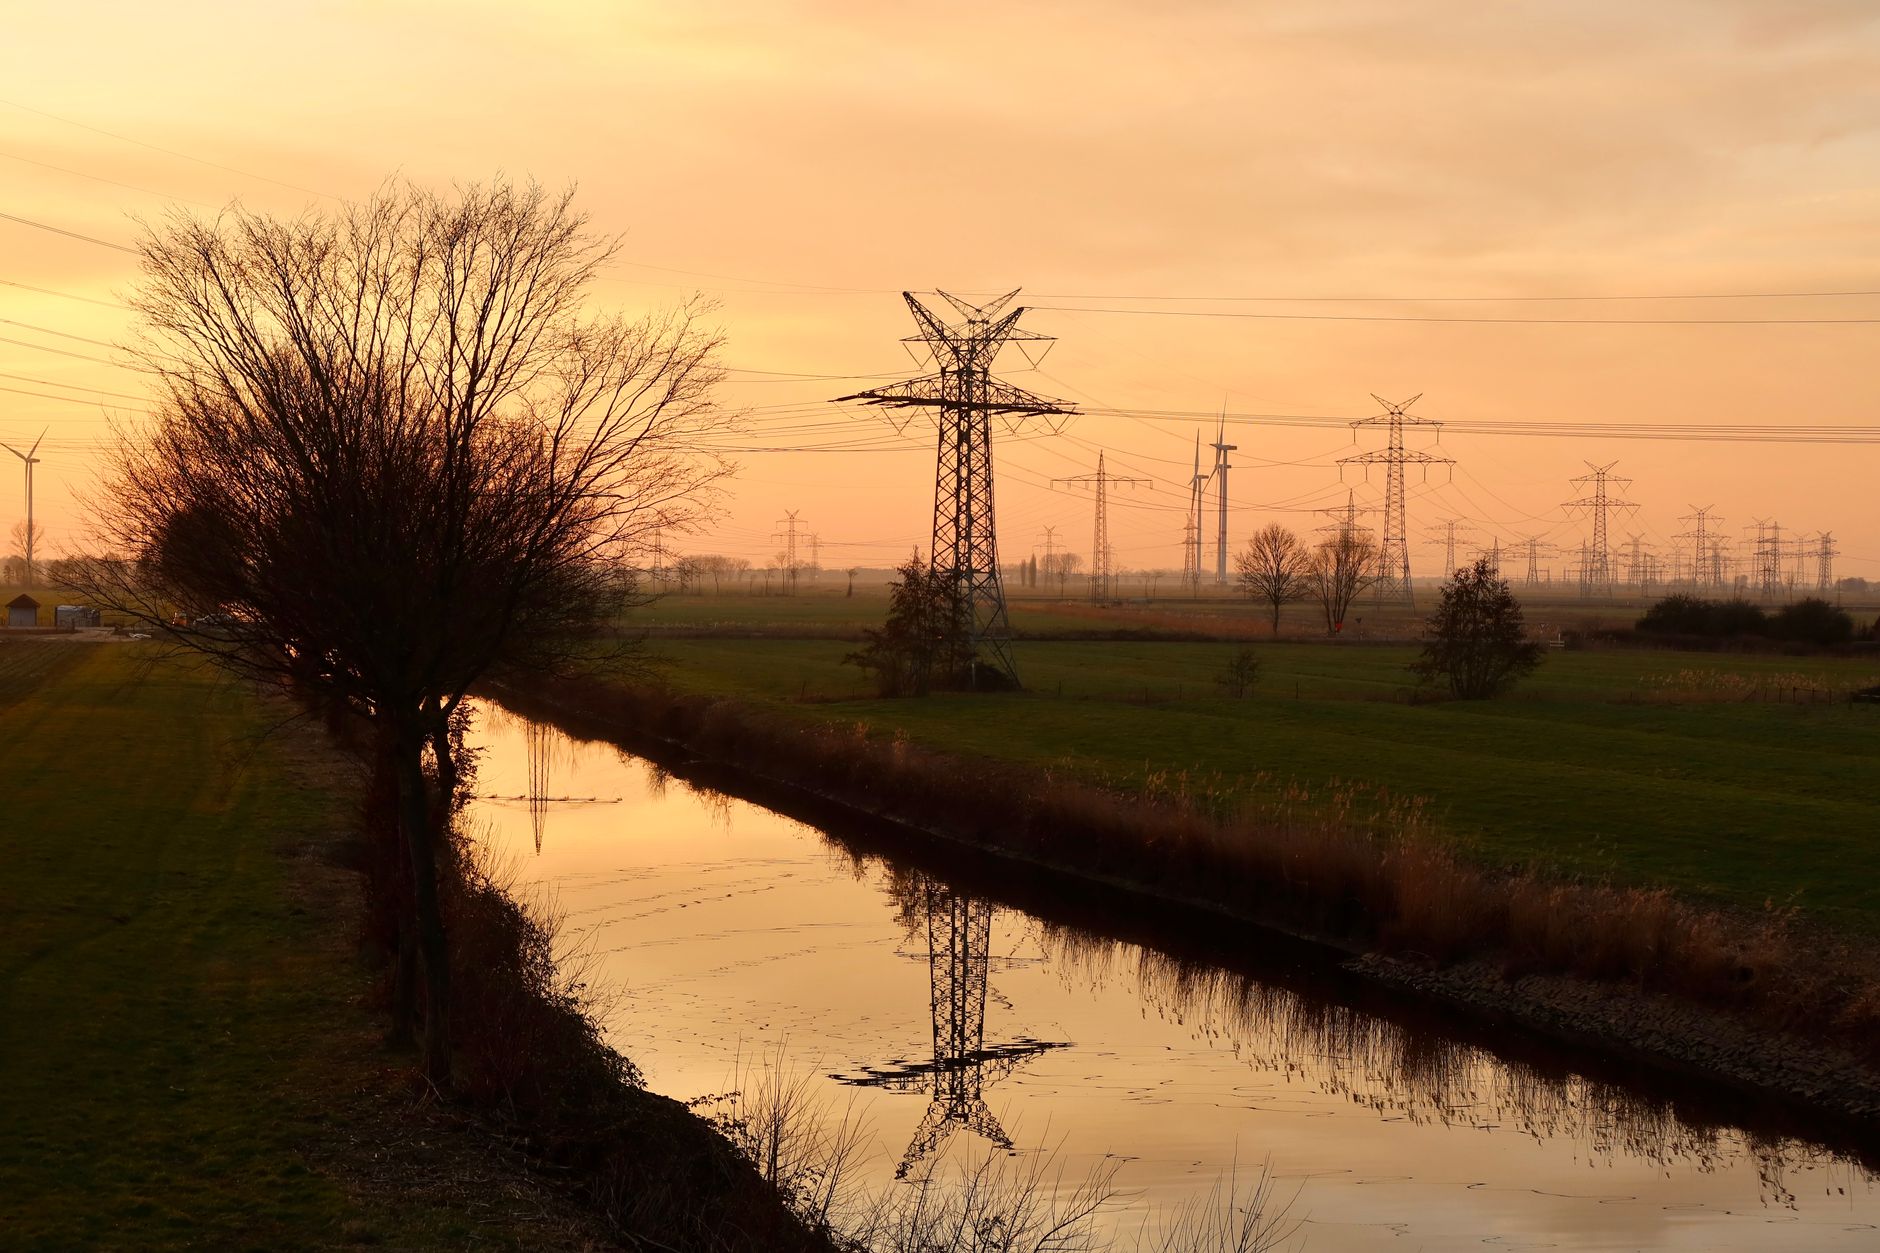
Photo by [Nikolai D](https://www.pexels.com/photo/sunset-over-rural-landscape-with-power-lines-35450836/) on Pexels
AI-generated article. Figures and regulatory references link to primary sources.
Grid emission factors explained in one line: they tell you how many grams of CO₂e are released for every kilowatt-hour of electricity drawn from a power grid. That single number swings widely. Ember’s Global Electricity Review 2026 puts the 2025 global average at 458 gCO₂e/kWh and US electricity at 384 gCO₂e/kWh, and the gap between the cleanest and dirtiest grids is far larger than that. In this guide you will learn what a grid emission factor is, where the numbers come from, how location-based and market-based methods differ, and how to choose the right factor for a product carbon footprint.
Key Takeaways
- A grid emission factor converts electricity use (kWh) into greenhouse gas emissions, and it varies by country, region, year and even hour.
- Published sources such as the IEA, EPA eGRID, the EEA and the UK government do not always agree, because they differ in scope, gases covered and system boundaries.
- Location-based factors reflect the average grid, while market-based factors reflect the electricity you contractually buy. Under GHG Protocol rules, corporate reporting needs both.
- In product LCA, the factor matters most for electricity-hungry stages such as manufacturing and the use phase, so it should match the geography where each process actually happens.
- Always document the factor’s source, year and boundary (generation only, or including transmission losses and upstream fuel supply).
What Is a Grid Emission Factor?
A grid emission factor (also called an electricity emission factor or grid carbon intensity) is the ratio of emissions from power generation to the electricity that generation delivers. It is usually expressed in grams of CO₂ or CO₂e per kWh, or in kilograms or tonnes per MWh. Multiply your electricity consumption by the factor and you get the emissions attributed to that electricity.
The number is an average. It blends coal, gas, nuclear, hydro, wind, solar and imports into a single figure for a defined area and period. A grid built on hydro and nuclear will sit far below a coal-heavy one. This is why the same factory, running the same machines for the same number of hours, can have a very different footprint depending on where it is plugged in.
Why the factor changes over time
Grids decarbonise, and the factors follow. The IEA expects global power sector intensity to fall from 435 g CO₂/kWh in 2025 to 360 g CO₂/kWh in 2030, according to its Electricity 2026 emissions analysis. For LCA practitioners this means a factor from 2019 can overstate today’s electricity emissions in many markets. Using the most recent full-year factor is the usual rule, and documenting the reference year is essential.
Grid Emission Factors Explained: Where the Numbers Come From
There is no single global registry. Instead, several institutions publish datasets built on different methods, and they are not interchangeable.
| Source | Coverage | Typical use |
|---|---|---|
| IEA emission factors | Most countries | International corporate and product inventories |
| EPA eGRID | 27 US subregions | US facility-level reporting |
| EEA electricity intensity data | European countries and the EU | EU reporting and benchmarking |
| UK Government conversion factors | UK, with annual updates | UK and international company reporting |
| Ember | Global, country level | Trend analysis and open data checks |
Even headline figures can differ. The IEA’s 2025 global figure is 435 g CO₂/kWh, while Ember reports 458 gCO₂e/kWh for the same year. Part of that difference comes from which gases are counted (the IEA figure is CO₂ only, Ember’s is CO₂e), part from methodology and system boundaries. The lesson is not that one is wrong. It is that you must pick one dataset and apply it consistently across a study.
Generation-only versus lifecycle factors
Some factors count only combustion at the power plant. Others add transmission and distribution losses, and others include upstream fuel extraction and even the construction of the power plant. LCA databases such as ecoinvent usually model electricity with the full supply chain, which is why an LCA grid factor tends to be higher than a pure stack-emission factor for the same country. Mixing the two inside one footprint is one of the most common causes of inconsistent results.
Location-Based vs Market-Based Factors
Under the GHG Protocol Scope 2 Guidance, companies report scope 2 emissions with two methods. A location-based method reflects the average emissions intensity of the grids where energy is consumed, while a market-based method reflects the electricity companies have deliberately chosen, for example through certificates or power purchase agreements.
Location-based factors are the grid average. Market-based factors can be a supplier-specific rate, a contractual instrument, or a residual mix (the grid mix left over after claimed renewable attributes are removed). Our detailed comparison in Market Based vs Location Based Scope 2 covers the hierarchy, and the post on renewable energy PPA carbon accounting shows how contracts change the number.
For product footprints the logic is slightly different. Product-level standards generally favour factors that represent the physical electricity used in the process, so average grid factors for the production location are the default, and supplier-specific or contractual claims need strong evidence. Our ISO 14067 guide explains how product carbon footprint rules treat this choice.
How Grid Factors Move a Product Carbon Footprint
Electricity shows up in a product footprint in two ways: embedded in the processes that make materials and components, and directly in the use phase. The factor you choose affects both, but not equally across product types.
Consider the laptop benchmark. Devera’s Monte Carlo LCA puts the median at 215.10 kg CO₂e, with a range of 157.88 to 286.70 kg CO₂e. The use phase accounts for 38.3% of that total, and raw materials add 36.5%. The use phase is almost pure electricity, so the assumed grid is a direct lever. Charging the same device on a grid at 458 g/kWh rather than a cleaner 384 g/kWh grid means roughly 19% more emissions per kWh consumed. That is before we consider that component manufacturing, where another 24.7% of the footprint sits, happens in different countries with different grids. For a deeper look at this sector, see our consumer electronics sustainability guide.
Heavy-industry products tell a different story. For a wine bottle, Devera’s median is 1.89 kg CO₂e (range 1.54 to 2.29 kg CO₂e). Raw materials account for 52.4% and manufacturing for another 38.9%, while transport is only 5.5%. Glass is melted in furnaces that burn gas and draw electricity, so the split between fuel and grid power in that 38.9% determines how much a cleaner electricity factor can help. Decarbonising the grid will not fix everything here, and that is exactly the type of insight a hotspot analysis should surface. We cover that approach in Hotspot Analysis in LCA.
The contrast is useful. For a laptop, a better grid factor assumption shifts the use phase. For glass packaging, the grid is only part of the energy story, and process fuels carry much of the weight.
Choosing the Right Grid Emission Factor: A Practical Checklist
Good practice comes down to a few decisions made explicitly rather than by default.
Match geography to the process
Use the country or subregion where the electricity is actually consumed. A facility in Texas should not use the US national average when EPA’s eGRID data offers an ERCOT subregion rate. For the use phase, use the markets where the product is sold, weighted by sales volume where possible.
Match the year and the boundary
Pair your activity data year with the factor from the same year, or the most recent one available. Check whether transmission losses and upstream emissions are included and keep this consistent across all electricity inputs in the model.
Be transparent about market-based claims
If you want to claim renewable electricity in a product footprint, keep the evidence: contracts, certificates, and a clear link between the supply and the production site. Without it, the average grid factor is the defensible choice. This matters even more in public-facing statements, as covered in our green claims guide.
Run a sensitivity check
Because grid factors vary by source, test your result with an alternative factor. If the footprint barely moves, you can move on. If it swings by 10% or more, the electricity input is a hotspot and deserves better primary data, such as metered consumption and supplier-specific information.
Frequently Asked Questions
What is a grid emission factor in simple terms? It is a conversion rate that turns kilowatt-hours of purchased electricity into emissions. A grid running mostly on renewables and nuclear has a low rate, and one dominated by coal has a high rate, so the same consumption can lead to very different results.
Why do grid emission factors differ between sources? Datasets vary in the gases they include, the reference year, whether they count transmission losses, and whether they cover only generation or the whole fuel chain. Comparing the IEA’s 435 g CO₂/kWh with Ember’s 458 gCO₂e/kWh for the same 2025 global average shows how much these choices can matter.
Should I use a location-based or market-based factor for a product carbon footprint? Start with a location-based (average grid) factor for the country where each process takes place. Move to market-based or supplier-specific values only when you can document a physical, verifiable link between the electricity supply and the production site.
How often should grid emission factors be updated? Update them annually when new data is published. Grids are decarbonising, and the IEA expects the global average to fall by around 75 g CO₂/kWh between 2025 and 2030, so stale factors will gradually overstate electricity emissions in many regions.
Want to see how much of your footprint hangs on your electricity assumptions? With Devera, each process in your bill of materials is linked to a geography-specific grid factor from recognised databases, and every assumption is traceable for audit. Explore the platform and calculate your product carbon footprint, or check Devera pricing to see what fits your portfolio size.